Metrics/Talos Investigation
This page contains a summary of the Talos investigations done during the fall of 2011 by Stephen Lewchuk an intern on the Metrics team in collaboration with the A-Team and RelEng.
Contents
Talos Background
Please note that the recommendations presented here proposed structural changes to Talos so this background will quickly become obsolete as the recommendations are implemented.
The full wiki documentation of Talos can be found here: Buildbot/Talos. The type of tests being considered in this research are the page load style tests where the aggregation process is completely inside Talos (i.e. tsvg, tp5, tdhtml, tsspider), while the techniques may apply to other tests (ts, dromaeo, ally) those tests were not specifically considered.
The top level unit of Talos as presented to developers is a testsuite. This testsuite is composed of a page set that contains between 10 - 100 different pages or components. Each testsuite is executed by loading each component in the page set once, recording the time taken for that page to load. Once complete the pageloader returns to the start of the component set and repeats this process. Most tests execute 5 iterations of this loop, tp is the exception running 10 iterations.
Once the matrix of results is produced the following aggregation process occurs: 1. Filter maximum value from times for each component. 2. Generate a median of the remaining values for each component. 3. Filter the maximum median from the set. 4. Produce an average of the remaining medians.
Steps 1 and 2 are done in the Talos python scripts and the raw values are not reported. Steps 3 and 4 happen in graph server and all the medians are stored. The single value produced at the end of this aggregation process is the number presented in graph server graphs.mozilla.org and graphs-new.mozilla.org.
Data Pipeline
In order to do proper investigations into the Talos data the raw run values were needed. A secondary pipeline outside of the Talos scripts and graph-serve was created. This new pipeline is an extension of the logparger hg.mozilla.org/automation/logparser project created for WOO. It ties into pulse and dumps the data into ElasticSearch. The ES server is currently hosted at: http://elasticsearch1.metrics.sjc1.mozilla.com:9200.
Extracting Data from ElasticSearch
To extract data from ElasticSearch for exploratory purposes a series of python scripts was created under the name ESTalosPull. The source is on github at https://github.com/mozilla-metrics/ESTalosPull. This script has a full command line interface for extracting data. The code has a modular analysis and formatting structure allowing for both csv and json output and a variety of levels of aggregation. A basic command looks like so:
python espull.py --es-server=elasticsearch1.metrics.sjc1.mozilla.com:9200 --index=talos --testgroup="chrome|chrome_mac"
--format=csv --analyser=run --analyser=build --analyser=comp --output=pine/tdhtml-chrome --tree=pine --all
--from=2011-12-01 --to=2011-12-31 --testsuite=tdhtml
This command pulls from ElasticSearch all of the tdhtml testsuite records from the month of December for all operating systems which ran a chrome or chrome_mac testgroup. The three output files are created, a run, a build and a component based file.
Basic Fields
These are the fields that all analysers current include:
- revision
- machine
- starttime
- testgroup
- testsuite
- os
- buildtype
- tree
Note that a unique run of the test is a revision,starttime pair not just a revision.
Build Analyser
This analyser is activated by adding to the command line specification:
--analyser=build
It performs aggregation across the entire testsuite producing one row per instance of the testsuite. It's fields are:
- graph_result - the existing aggregation result
- graph_std - the standard deviation of existing average
- new_result - the proposed aggregation result (see filtering)
- new_std - the standard deviation of the proposed average
Component Analyser
This analyser is activated by adding to the command line specification:
--analyser=comp
It performs aggregation across each component, producing one row per component in a testsuite. It's fields are:
- build_id - a numerical index which all components from the same instance of a testsuite share
- test_name - the name of the component
- test_runs - the number of runs of that component which are aggregated in this entry
- max - the maximum value for an individual run
- min - the minimum value for an individual run
- test_0 - the value for the first value of the component
- graph_median - the result of the current component aggregation process
- new_median - the result of taking the median of the values except the first
- new_average - the result of taking the average of the values except the first
- new_std_dev - the standard deviation of the values except the first
Run Analyser
This analyser is activated by adding to the command line specification:
--analyser=run
It performs no aggregation producing a row for every page load. It's fields are:
- build_id - a numerical index which all runs from the same instance of a testsuite share
- test_name - the name of the component loaded.
- run_num - the run number
- value - the result
Notes about build_id
First, note that the mapping of revision,starttime to build_id is 1:1 but revision to build_id may be 1:N as multiple copies of the test may be run on the same revision. Also the build_ids are a produced by the ESTalosPull scripts and may be different for subsequent runs of ESTalosPull, especially if the parameters change. As a result they should only be used within a data set to group entries. Finally, though the build_ids start at 1 and increase this is the order they were extracted from ElasticSearch not the order they were executed in, the starttime should be used for that ordering.
Data Structure Insights
The following sections detail some of the interesting structures that were observed in the data during the exploration of the data.
First run differences
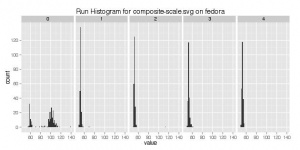
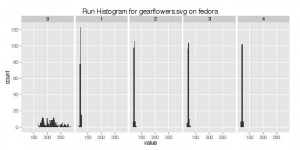
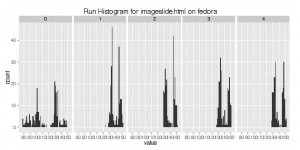
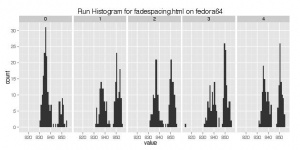
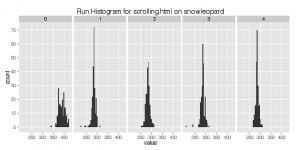
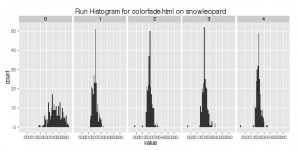
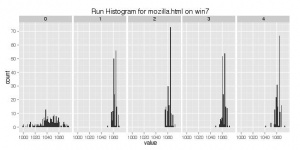
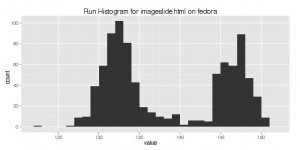
One of the first piece of structure is that the distribution of load times for the first load of each component are often very different from the distribution of load times for the remaining runs.
Examples:
- fedora:svg:tsvg:composite-scale.svg
- fedora:svg:tsvg:gearflowers.svg
- fedora:chrome:tdhtml:imageslide.html
- fedora64:chrome:tdhtml:fadescaing.html
- snowleopard:chrome_mac:tdhtml:scrolling.html
- snowleopard:chrome_mac:tdhtml:colorfade.html
- win7:chrome:tdhtml:mozilla.html
Non Normal distributions
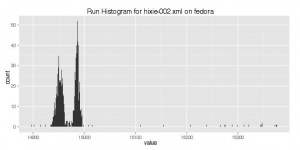
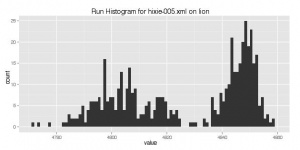
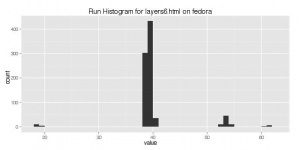
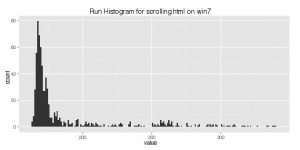
The next piece of structure that was discovered is that many of the tests had non gaussian (normal) distributions. That is there wasn't one single central value with small variations around that value. Some of these distributions were multi modal, where there where several different values the results clustered around, others were long tailed distributions where there was concentration of results around one value but also a high density at higher or lower values.
Examples:
- fedora:svg:tsvg:hixie002.xml
- lion:svg:tsvg:hixie005.xml
- fedora:chrome:tdhtml:imagelide.html
- fedora:chrome:tdhtml:layers6.html
- win7:chrome:tdhtml:scrolling.html
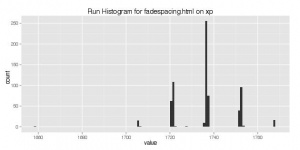
- xp:chrome:tdhtml:fadespacing.html
There are several consequences of these non gaussian distributions. First, is that simple tests such as the t-test we are currently using are less effective at detecting changes. It is possible for a change to dramatically affect these distributions without significantly impacting the mean of the distribution. Second, determining what an improvement or regression can be much more difficult with these types of changes. Finally, it means that much larger samples sizes are needed to fully describe the distribution.
Higher run count structure
Given some of the structure observed in the data above one obvious route to improve the data was to increase the number of repetitions that each component is loaded. Before doing so we needed to see if the high number runs would show the same distribution as the first few runs. As such an experiment was setup on the pine tree where instead of loading the pages 5 times they would be loaded 100. As of the creation of this page this experiment has only been run on the fedora:chrome and xp:chrome test groups.
Looking at the tdhtml testsuite for these two operating systems, the first conclusion is that in general the higher number runs have the same performance characteristics as the lower order ones. Thus in principle increasing the number of runs will constitute increasing the number of samples from the same distribution. However, additionally some apparent structure was seen in the data.
Fedora:chrome:tdhtml
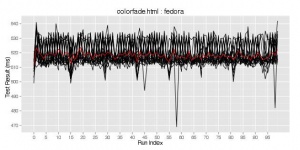
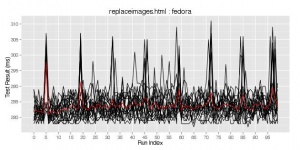
In fedora the additional structure came in the form of regular spikes either above or below the typical values for some of the components.
Examples:
- colorfade.html
- replaceimages.html
Xp:chrome:tdhtml
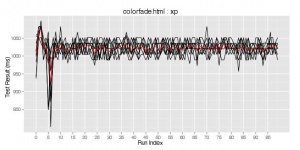
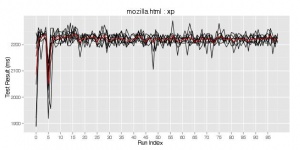
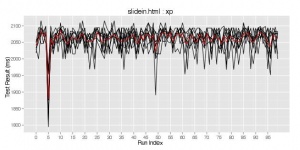
In xp no regular spikes were observed however around run 5 or 6 there were significant spikes (~ 10%) below the standard range of values.
Examples:
- colorfade.html
- mozilla.html
- slidein.html
Filtering Process
The current aggregation process has several downsides. One of these downsides is the filtering process.
Component Aggregation
The intra component aggregation as it is currently performed does provide some noise reduction by hiding anomalously large run results. However when applied to multi modal distributions it has the impact of severely skewing the distribution by suppressing the largest of the modes for that component. Additionally, it makes no effort to mitigate the noise introduced in many of the components where the first run has a significantly different and in some cases highly variable distribution.
Testsuite Aggregation
The inter component aggregation provides little observed benefits in noise reduction however it does imposes a significant penalty to the signal by completely hiding the value of the largest of the components. Thus we are expending significant computational effort and then discarding the result.
Power Analysis Simulations
The concept behind power analysis is a way to determine the sample size required to answer a statistical question correctly a certain percentage of the time. In the case of Talos the question we used in the calibration step was to take the population mean and reduce it by a certain percentage (the detection threshold) then a sample was taken from that population and using a one-sample T-test against that adjusted mean. If the statistic returned by the T-test was less than the confidence threshold then we say the test answered the question correctly. To determine the necessary sample size we generated a population of possible values based on the results of the experiments in the pine branch. We then performed a large number of samples from that population with different sample sizes and performed the T-test. Once the simulation was complete we calculated the proportion of correct results of the T-test and plotted them. With this data a sample size can be chosen which gives desired detection probability after a single sample. The step by step process to repeat this experiment is as follows:
- Generate 10 - 20, 100 run samples from a single revision of the test suite under investigation, the higher the number the better the results
- Pull the data from ElasticSearch.
- Visualize the data, identifying any structural features or anomalies, for the most part structural features can safely be ignored, though it will introduce some additional noise in the simulation not present in the actual data, resulting in higher than necessary results. Anomalies should be removed from the data, the goal here is to create a sample population of typical values to handle the inherent noise of the population, not handle unknown anomalies.
- Filter out the first value from the population, to replicate the filtering techniques used.
- For each component write the filtered data into a file with one value per line.
- Use the simulate.py script to run simulations for each component.
- Examine the *_detect.csv for each component and use the less_ratio and the desired detection probability to select the appropriate sample size.
Replicating the TDHTML - Fedora Simulation
The data for this simulation was generated on the pine branch using revision e320f9f5536f. All of the commands will be available in the sample folder of the ESTalosPull repository.
The data was extracted with the following command:
python espull.py --es-server=elasticsearch1.metrics.sjc1.mozilla.com:9200 --index=talos --format=csv --analyser=run
--tree=pine --testsuite=tdhtml --revision=e320f9f5536f --os="fedora" --testgroup=chrome --all --output=pine/tdhtml
The data consists of 21 runs of the testsuite and was then loaded into R and visualized, in this case one run of replaceimages.html had an anomaly near the end and thus that data was filtered out. The filtering code looked like so:
data = subset(tdhtml, run_num != 0 & !(test_name=="replaceimages.html" & starttime == 1322991336))
The data was then written out in individual files.
library('plyr')
d_ply(data, .(test_name), function(f) write(f$value, file=paste(f$test_name[1], "dat", sep="."), sep="\n"))
This produced a series of files named colorfade.html.dat, fadespacing.html.dat, etc. The simulation for colorfade.html was run with
python simulate.py colorfade.html.dat colorfade.html --min_sample=3 --max_sample=50
This produced three output files:
- _rev.csv - a csv with sample_size, mean and median columns
- _conf.csv - a csv with sample_size, T-test statistics for comparing the sample against the population mean, mean*(1-detection_threshold), mean*(1+detection_threshold), and a boolean value (True/False) of whether the question was answered correctly
- _detect.csv - a csv with one row per sample_size indicating the ratio of detection for the actual mean, the lowered mean and the raised mean.
The _detect.csv files can be loaded into R or examined manually to determine the appropriate sample size for the desired detection probability.
The parameters for the simulation used for the Fedora-TDHTML calibration were:
- detection_threshold = 1%
- confidence_threshold = 95%
- detection_probability = 95%
These parameters indicate that we desire that 95% of the time when a 1% regression occurs a T-test using 95% threshold will detect the regression.
Simulation Results
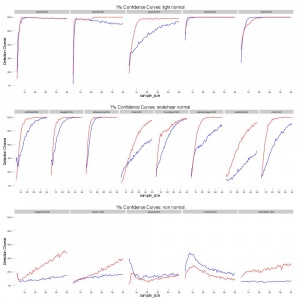
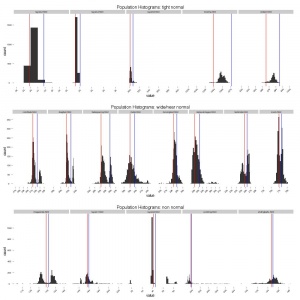
The results of the simulations are presented in the graphs below. The red line is the detection of the 1% regression and the blue the 1% improvement. Many of the curves rise quickly from ~30% then asymptotically approach 100%. Others have much less desirable curves either growing slowly or in the case of scrolling.html actually decay. To understand these behaviours we need to take a look at the histogram of values for each of these components. Doing so we defined three categories of tests.
- Tight Normal - These components appear to be normally distributed about a mean with most of the variation staying less than 1% away from that mean. These results for these tests are characterized by rapidly approaching 100% detection.
- Wide/Near Normal - These components are either normal but with variation greater than 1% or have multi modal distributions but the two modes are still relatively close to the mean. This results for these tests are characterized by approaching 100% but at a slower rate.
- Non Normal - These components are significantly different from a normal distribution with either many modes, heavy tails or modes that differ significantly. The results for these tests are characterized by either approaching 100% very slowly (even at 50 samples the detection was never above 50%) or even decreasing as the sample sizes increase.
This classification approach produces the following categorizations:
| Tight Normal | Wide/Near Normal | Non Normal |
| layers2.html | colorfade.html | imageslide.html |
| layers4.html | fadespaceing.html | layers1.html |
| layers5.html | replaceimages.html | layers6.html |
| mozilla.html | meter.html | scrolling.html |
| slidein.html | movingtext.html | slidingballs.html |
| textslide.html | ||
| diagball | ||
| zoom.html |
The charts below of the confidence curves and population histograms are segmented using this classification approach as well.
Testsuite Calibration
The end result of the simulations described above is that different components will require different, sometimes vastly different, number of repetitions to achieve the same accuracy. To calibrate the components of an individual testsuite, the simulations were run 20 times for each component. This allowed the generation of 95% confidence intervals on the detection percentage at each sample size and use the 95% detection threshold to calibrate the necessary number of samples. Using this approach we can calibrate all of the tight normal and most of the wide/near normal to achieve this threshold with less than 30 repetitions as sometimes as few as 6. Here are the results, those at 30 were not able to get to the 95% threshold.
| Tight Normal | Wide/Near Normal | Non Normal |
| layers2.html 8 | colorfade.html 25 | imageslide.html 30 |
| layers4.html 6 | fadespaceing.html 12 | layers1.html 30 |
| layers5.html 11 | replaceimages.html 27 | layers6.html 30 |
| mozilla.html 7 | meter.html 30 | scrolling.html 30 |
| slidein.html 15 | movingtext.html 30 | slidingballs.html 30 |
| textslide.html 30 | ||
| diagball 19 | ||
| zoom.html 19 |
Recommendations
Proposed Filtering Changes
The proposed aggregation scheme attempts to address the above issues. There are several other issues (presented below) but this is a good first step. The change is present in Bug 710484.
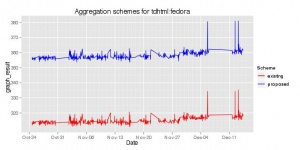
1. Filter the first run from the set of runs for each component. 2. Generate the median of the remaining run values for each component. 3. Generate the mean of the component medians.
The impact of this aggregation scheme on the results is minimal. See below the effect for the fedora:chrome:tdhtml testsuite during the month of November. The red line is the existing scheme and the blue line is the proposed scheme.
Unrolling Talos
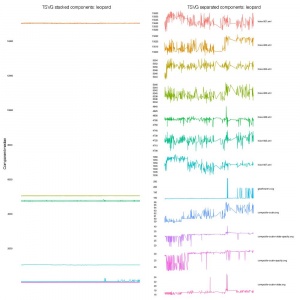
One of the structural features of Talos that presents a significant constraint on the ability to detect changes is the structure of the testsuites. As it currently stands all of our regression techniques are performed on the aggregate across a whole testsuite. This poses a significant issue because the components vary widely in both scale and variance. The difference in variance can be seen in the results of the calibration simulations, where some were able to quickly detect 1% changes and others were never truly able to do so. In terms of scale the TSVG testsuite is perhaps the best example of this. On leopard the hixie-001.xml and hixie-002.xml components both take ~ 15 seconds to load, while the composite*.svg pages all take between 20 and 100 ms.
Separate Signals
To handle the differences in components, any automated technique should be looking at the individual components. By averaging these different components, changes that only impact the shorter components will be near impossible to see as they will be swamped in the noise of the far longer tests. Even for changes in the longer tests the magnitude of the changes is still reduced by almost an order of magnitude in some cases.
Per Component Calibration
From the simulations we see that different components require different sample sizes. As such we should make an effort to break apart Talos to allow each component to be run only the required number of times it is needed. This will involve significant restructuring of Talos and the pageloader but will yield improved results with much reduced cost.
One caveat to the calibration is that it is for a specific build of Firefox, as changes are made, the distributions change and over time the validity of the calibration is reduced. As such I recommend that every quarter the simulations should be re-run and the runs per component be re calibrated.
Record Raw Results
At the present moment, the intra component aggregation is done entirely within the Talos python scripts. As such those numbers are not reported to graph server. The raw results are recorded in ElasticSearch however, the pipeline to ES is still being developed and may not be ready for a production system. As such it is important that we start recording the raw result times in our production system for regression detection processes to use.
Future Work and Ideas
Run Structure Investigations
The long run experiment has yielded some interesting structure, see above. This structure is worth investigating as it may indicate aspects of Firefox that could be improved. If not it is still worth understanding the source of this structure so that they can be taken into account when do performance evaluations. Some potential avenues from the statistical side would be to treat the runs as time series and attempt to construct a model using the tools from that domain. Another avenue of research would be to do frequency analysis to see if there is some underlying patterns that influence the results.
Multi Modal Structure Investigations
The presence of multi modal distributions of render times is a worrisome feature of the data. My impression is that it indicates some structural ambiguity in the rendering processes beyond random noise introduced by the underlying platform. I would contend that a feature like a race condition could be the cause of some of these distributions. The multi modal nature of the data should be investigated to understand the causes and if possible to eliminate these. While the multi modal data hampers the ability to detect changes in performance at moderate sample rates, the goal should be to eliminate the underlying cause of the multi modal distributions as opposed to selecting tests which have nicer distributions.
Impact of Talos Unrolling
One of the proposals moving forward is to have each each component be run individually with a specific number of repetitions. To implement this the existing process of loading the whole page set before repeating will have to change. This modification has the large potential to significantly effect not only the values for those components but also to change the structure and distribution of results. Before whole sale changes are made to adopt this approach, the impact it has, separate from changing the number of runs needs to be understood. If there is an impact then the simulations and calibration steps need to be rerun on these new distributions before being implemented.
Alternate Test Questions
One of the issues that was encountered was that the non-normal nature of many of the components presented a problem when a simple T-test was applied. Effort should be placed in investigating alternate summaries of the data and tests that could be applied to detect changes in the distributions. An example might be to apply a log transform to the scrolling.html results, eliminating the long tail, this might improve the results however the question of what detection_threshold to use would need to be investigated
Correlation with Real World Performance
We currently run a very large number of components, especially in the TP testsuite. While the TDHTML and TSVG are in theory designed to test specific features of FF, those in the TP testsuite are simply a selection of pages from the internet. An interesting study would be to attempt to use performance metrics from sources such as Telemetry to identify which of those 100 pages are good measures of actual performance. Additionally we may be able to reduce the page set for TP by identifying pages which produce the same performance profiles over time and thus one could be eliminated. Never mind please close this.
