DevTools/Features/Highlighter
Status
| Page Inspector / Highlighter | |
| Stage | Complete |
| Status | Complete |
| Release target | Firefox 10 |
| Health | OK |
| Status note | ` |
Team
| Product manager | Kevin Dangoor |
| Directly Responsible Individual | Kevin Dangoor |
| Lead engineer | Rob Campbell |
| Security lead | ` |
| Privacy lead | ` |
| Localization lead | ` |
| Accessibility lead | ` |
| QA lead | Teodosia Pop |
| UX lead | ` |
| Product marketing lead | ` |
| Operations lead | ` |
| Additional members | Paul Rouget |
Open issues/risks
`
Stage 1: Definition
1. Feature overview
The Page Inspector is a web designer-oriented feature that was initially planned for Firefox 4 (as the Inspector) but was not ready in time to ship. The time in between has allowed us to rethink the tool.
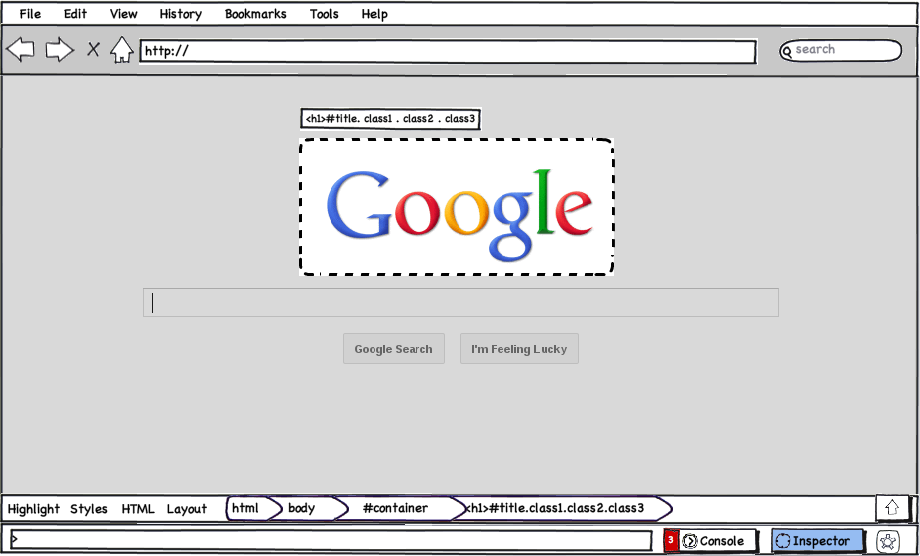
The Page Inspector is a visual entry point into tools that help web developers work on their page designs. The central part of the Page Inspector is the Highlighter. It gets its name from the distinctive way in which it highlights an element on the page. The Highlighter presents some information and controls right near the element itself, making the most common operations quick and easy.
The Page Inspector is a gateway to "element-centric" tools. The most important of these tools is the Style Inspector, which provides detailed information about the CSS applied to the selected node. These other tools are selected via a toolbar that also provides quick access to other elements around the highlighted node.
It is also planned that the HTML Tree view will be available as another way to move the highlight from one node to another.
2. Users & use cases
All web developers and designers of many different skill levels need to work with CSS and therefore will use the Page Inspector regularly.
Tracking Down a Styling Issue
The Page Inspector is part of the Font Fixing use case.
Learning About a Page
Starting with the original "developer tool" for the web, View Source, people have always used tools to look at existing sites and learn about what makes them work. The Highlighter and the element-centric tools that are accessed through it can help with this.
On the front page of CNN.com, there is an accordion widget. How does that get its sleek grey gradient?
Making Common Changes To Nodes
Add/remove CSS classes, manipulate the ID
3. Dependencies
`
4. Requirements
- [DONE] #F2 Inspect in Web Developer menu
- [DONE] #F8 Button to switch between inspect and selected modes
- [DONE] #F9 Toolbar buttons to toggle other tools
- [DONE] #F11 Element tools are contained in a sidebar (ideally one that doesn't cause reflow)
Desired, but not required for release:
- [DONE] #F1 Context menu item to inspect element
- [DONE] #F10 Toolbar button to display the HTML tree
- #F4 Display margins and padding (now in DevTools/Features/LayoutInHighlighter)
- [DONE] #F3 Select an element via the command line
- not now #F12 Ability to pop the sidebar out into a separate window
Non-goals
The initial version does not need to be remotable. The initial version does not support multiple element selection.
Stage 2: Design
5. Functional specification
Terminology
Note: this terminology has changed from the original design of this feature. The tool that is used to dive into a page is called the "Page Inspector" or just the Inspector. If we refer to the "Highlighter" that is just the part of the Page Inspector that visually shows the selected page element.
The tool that lets you visually select an element on that page for use by "element-centric" tools (such as the Style Inspector) is called the Page Inspector or just Inspector. It has a menu item on the Mac at Tools->Web Developer->Inspect and on Windows at Firefox->Web Developer->Inspect. You can also get to it via a "Inspect Element" context menu item.
The Inspector has two modes:
- Inspection mode – as you move the mouse around, the highlight follows until you click a page element
- Selected mode – an element is selected and you can freely move the mouse around without changing the selection
The Inspector Toolbar has a button, labeled "Inspect" that switches between the Inspection and Selected modes.
Invoking the Page Inspector
You can launch the Page Inspector by right-clicking on an element and selecting "Inspect Element" from the context menu (F1). This will bring the Inspector into view with the element under the cursor already selected. The element is in the "selected" state.
You can also launch the Inspector via the "Web Developer" menu ("Inspect" menu option) (F2). The Inspector will start out in the "inspection" mode.
When the Developer Toolbar lands, there will also be a Inspect button there.
Finally, you can use the command line to select an element (F3). Multiple selected elements are not supported right now.
Modes
The Inspector has two modes: "inspection" and "selected". In "inspection" mode, moving the mouse around will highlight the element of the page that's under the cursor. If you click on the element, you switch to "selected" mode and you can then move your mouse around without changing which element is highlighted. You can click the "Inspect" button in the Inspector Toolbar to switch back into inspection mode.
Selected Element Display
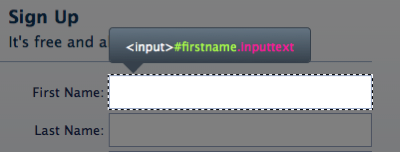
When an element is selected, the rest of the page is dimmed. Near the element, there is an "Infobar" that provides a quick view of information that is useful to page designers (see below).
Around the element, the margins and padding are displayed (F4).
Infobar
When you select a page element, the "infobar" appears to quickly give you the most useful information about that element.
Features:
- displays tag name, ID, CSS classes
There is a separate feature to add basic editing to the Infobar.
Page Inspector Toolbar
The Inspector Toolbar appears above the Developer Toolbar at the bottom of the window and provides access to element-oriented tools and quick, precise access to other elements.
Features:
- "Inspect" button switches between inspection (choose an element) and selected modes (F8)
- Buttons toggle the tools sidebar on/off and which tool is in the sidebar. For example, clicking the Styles button will show the style inspector. The initial expected buttons cover the Layout and Styles. (F9)
- Breadcrumb-style navigation from the selected element all the way up to the top of the document and down to the next child
- Button to slide the toolbar up and make room for the HTML Tree (F10)
Sidebar
Today's screens tend to be wider than they are tall. By placing as many tools as possible in a sidebar on the right, we can take better advantage of the available screen real estate.
Features:
- As with the Web Console, opening a tool in the sidebar changes the viewport size but does not cause a reflow (instead adding a scrollbar if necessary) (F11)
- Also similar to the Web Console, tools opened in the sidebar can be popped out into separate windows. (F12)
6. User experience design
In progress mockups are here:
https://wiki.mozilla.org/User:Rcampbell/DevToolsPlanning
Stage 3: Planning
7. Implementation plan
`
8. Reviews
Security review
`
Privacy review
`
Localization review
`
Accessibility
`
Quality Assurance review
https://wiki.mozilla.org/QA/Waverley/Developer-Tools/Highlighter/TestPlan
Operations review
`
Stage 4: Development
9. Implementation
`
Stage 5: Release
10. Landing criteria
`
Feature details
| Priority | P1 |
| Rank | 1 |
| Theme / Goal | ` |
| Roadmap | Developer Tools |
| Secondary roadmap | ` |
| Feature list | Desktop |
| Project | ` |
| Engineering team | DevTools |
Team status notes
| status | notes | |
| Products | ` | ` |
| Engineering | ` | ` |
| Security | sec-review-complete | 9-Dec-2011 |
| Privacy | ` | ` |
| Localization | ` | ` |
| Accessibility | ` | ` |
| Quality assurance | ` | ` |
| User experience | ` | ` |
| Product marketing | ` | ` |
| Operations | ` | ` |

