Firefox OS/Performance/Boot Sequence Optimization
Initial Ideas
- Minimize data loaded by boot loader.
- Compacting vmlinuz/zImage by moving compiled-in drivers to modules.
- Minimize initial ramdisk if there is one.
- Minimize kernel cruft by excluding all unneeded drivers.
- Strip the kernel and all modules.
- Minimize init launch sequence.
- Make init only launch the bare minimum for b2g process to launch.
- Ideally, init will only launch b2g.
- B2G start-up sequence.
- Remove all synchronous external dependencies from B2G start-up sequence.
- Kernel modules must be lazy loaded as needed.
- Any sync waits on daemons must become async. Start-up b2g pieces as daemons finish launching.
- Minimize start-up initializations.
- Global statics need to be minimized as their constructors are run before main().
- Global singletons must be initialized as needed.
- Remove all synchronous external dependencies from B2G start-up sequence.
- Homescreen start-up.
- Minimize _init() code to bare minimum.
- Maybe freeze the homescreen app into a memory image that can be loaded and unfrozen instead of launching the app every time.
- Eliminate dependency on enumerating installed apps on launch.
- Cache the list in local storage?
- Cache the list in the frozen memory image?
- Speed up mgmt.getAll()
The Plan
Bootchart
Bootchart is a tool for collecting data on OS boot, and then processing it into easily digestible charts. Some example preliminary data collected via bootchart here.
To enable the collection of bootchart data in FireFox OS one must build init with the following environment variable set.
INIT_BOOTCHART=true
Once init on the device has been replaced with the bootchart-enabled version (see process here), to begin logging one simply creates a file |/data/bootchart-start| on the device containing an integer representing the number of seconds for which bootchart should collect data, and then reboots the device.
Bootchart data is pulled from the device with the system/core/grab-bootchart.sh script, and presented in the form of a bootchart.tgz file. With the data collected one can then generate graphs by invoking:
java -jar bootchart.jar -f eps bootchart.tgz
Without the |-f eps| parameters, the default is for a PNG to be generated. The SVG format is also supported.
Note that the charts generated by the stock bootchart.jar do not seem to include disk stats. This is because it does not recognize the mmcblkNpM format of disk partition names, and this can easily be fixed in the bootchart source code (in particular, in |bootchart-0.9/src/org/bootchart/parser/linux/ProcDiskStatParser.java|).
Another bootchart related change made was in regards to how it records collected data. By default the process name is discarded and replaced by the 'cmdline' invocation (found in proc/PID/cmdline). This is not very useful considering b2g apps are then all shown as "Plugin-container". Init was modified such that both names are recorded.
Data
Data collected is organized as follows:
  repo-state        -> Information about the state of the source tree that applies to this experiment.
                       Note that things such as changes in init.rc, kernel arguments would not be visible in this

  manifest.xml      -> Repository info auto-generated by repo. This can be used with repo to reset the tree
                       (not including changes to the working tree)

  experi-info       -> Information about this particular experiment

  N/                -> Each of the numbered directories represent one sample of data

  N/bootchart.N.tgz -> Bootchart archive encapsulating the data that was collected

  N/kmsg.N          -> A dump of the kernel logs of the device
                       Contains timestamp for when init has started, and time stamp for when b2g.sh is run by init
                       (and misc. other component initialization)

  N/logcat.N        -> A dump of the android logs of the device
                       Contains timestamp of when b2g has started (which is also useful to synchronize with kernel log times)
                       (since logcat logs time absolutely, and kmsg as an offset from startup

  N/rebootstamp.N   -> Local unix time recorded directly after an adb reboot to approximate time of boot

  N/synchstamp.N    -> Kernel logs are time since boot and so are the process start times, this file contains the local time and the current device
                       uptime so that one may determine when the kernel logs were initialized
Old Baseline statistics These results were collected but I then decided to base my experiments on the newer v121 baseimage.
Note that all data collected applies to the Flame reference device.
This is data collected for the purposes of establishing a baseline. For this and future data collection, at least 30 trials will be recorded. Also in the root directory there are a few randomly selected trials for which charts were generated for quick reference.
A rough idea of what was seen, as well as empirical hypotheses:
- B2G starts after roughly 8s of mysterious "stuff", impenetrable to bootchart
- Based on kmsg, it is likely that time between 5s and 8s is init script execution up until
|class_start main|in the init.rc (which launches B2G service) - Vertical is shown as coming up around 16s, however it is actually just the preallocated process at this point, which later becomes vertical (around 22s-23s).
- As well it seems we are only at the init entry point around 4 seconds in anyway (based on inserted kernel log output)
- As such it is likely that
- -3.5s = bootloader + Early kernel
- 0s = kernel timing initialized
- ~4.5s = init main
- 7-8s = B2G
- ~14s = (Nuwa)
- ~16s = Preallocated
- ~22s = Homescreen app?
- ~25s = UI presented to user
Of note is that there exists a pronounced black screen between the T2mobile and the "Mozilla Developer Network" logos, that was introduced at some point. Dave Huseby has noted in the past that such a noticeable black screen exists in other devices. This was less visible in past versions.
Of course, there is more concrete data, but that is the general trend of things.
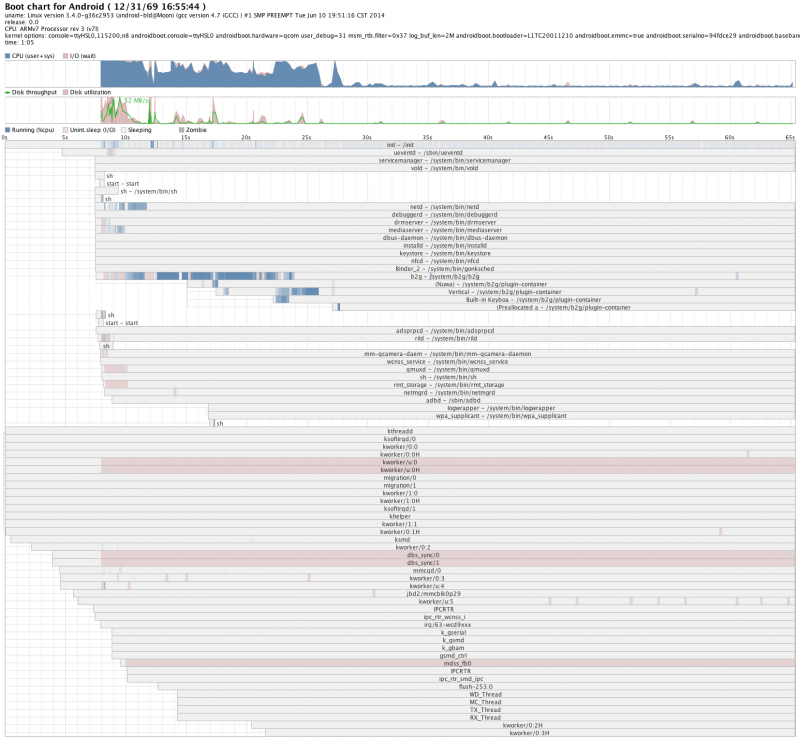
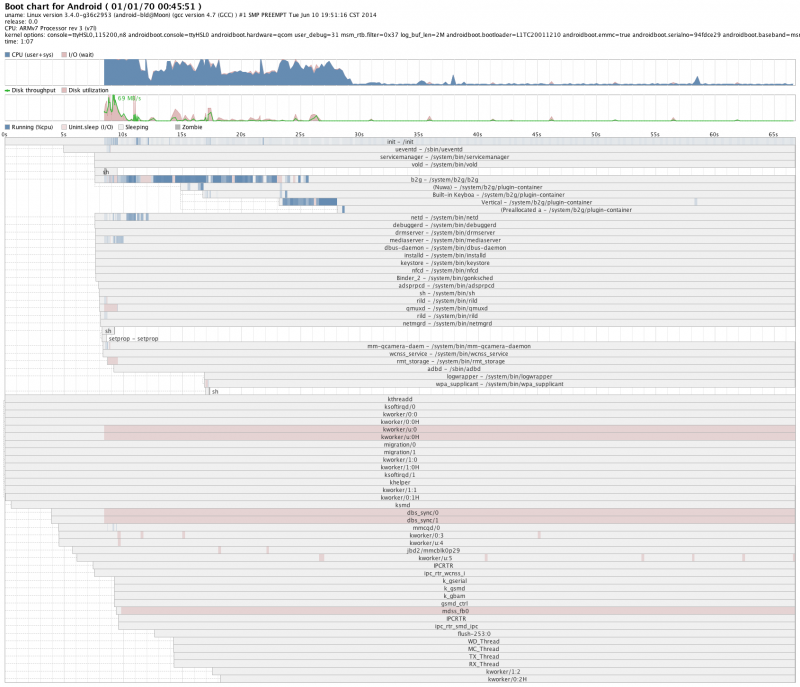
In this simple experiment a change to "init.rc" was made. By default b2g was started along with a host of other services in the same class "main". For this experiment B2G was moved into its own class that was started just before main. As expected this did not have significant effect in when B2G was launched however, since these were all launched in fairly quick order. Quantitatively one does notice a difference in the bootchart images reflecting B2G being started slightly earlier.
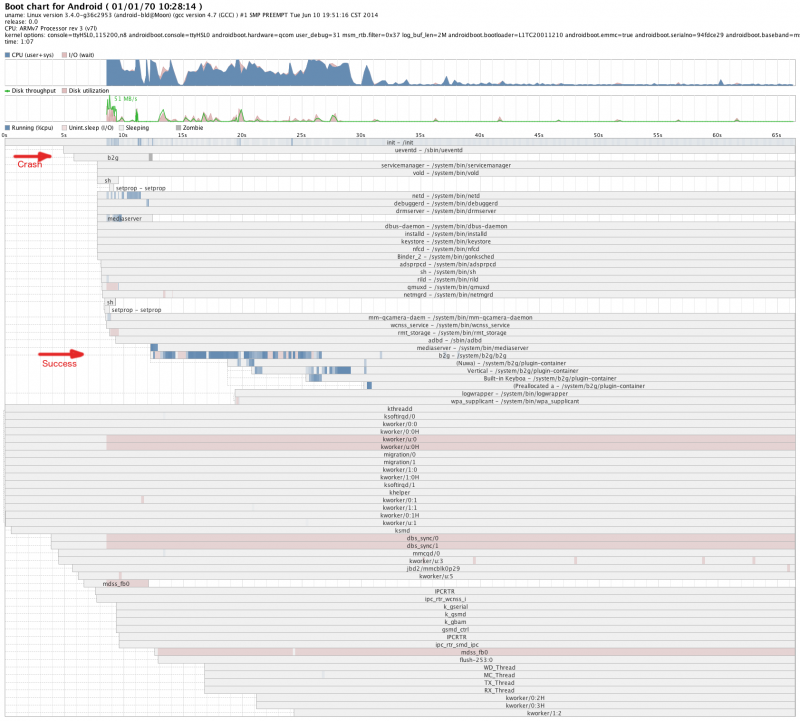
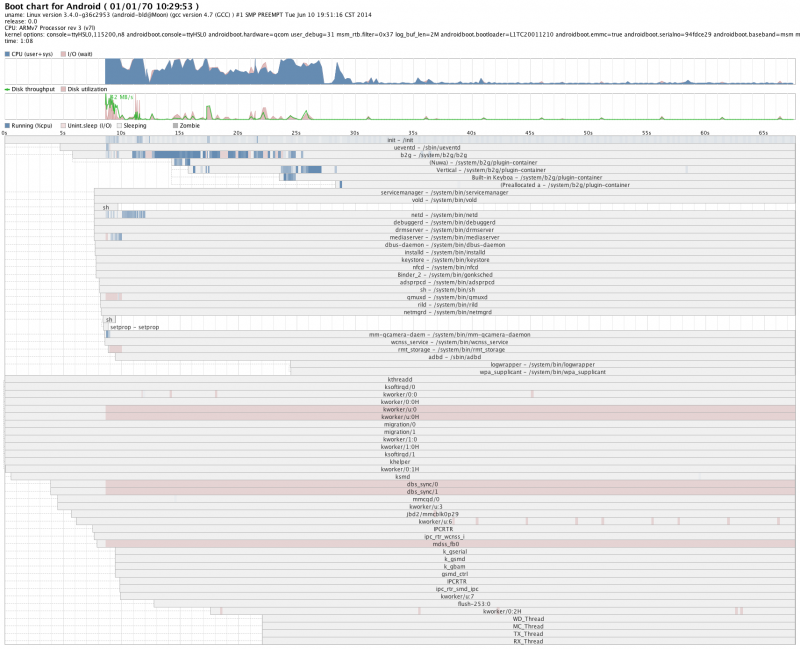
In these images, each horizontal bar represents the lifetime of a process. A processes children are below it, and parent child relationships are indicated by a dotted line from the parent going into the beginning of the child's bar. The process bars are in order of launch time (earliest first). Blue segments of the bar represent CPU activity while pink segments indicate IO.
Based on the current code, the earliest it is conceivably possible to run B2G would be in the early-init stage of init.rc. This stage was observed to be executing at around 4.8s of uptime. Realistically a lot of things would need to be changed for this to work (that is to say, a lot of things break when this is attempted). A more logical stage would be early-boot (which is not used in the default init script, however is a supported stage that occurs between post-fs-data and boot). What is notable about this stage is that, A.) if done here, B2G launches at around 5.8s and B.) It successfully runs. Sometimes. There are clearly some dependencies that are not quite guaranteed to be ready if one attempts to launch B2G this early, which could be the subject of a future investigation to see if those dependencies could be moved earlier as well. However as it stands, this only launches B2G around 2 seconds earlier. and there actually was no decrease in overall boot time observed (again dependencies not being respected comes to mind as an explanation, or gaia/gecko depending on some other service being initialized).
Related Data. Fewer trials were done because these were just cursory feasibility tests. One will note that in the first 13 trials B2G tries to launch, crashes, and then relaunches at around 12s, whereas it starts fine for the last 3. Seen below is a sample of a run in which B2G crashes vs. not
In particular one can search for the string OPTBOOT in the kmsg.N and logcat.N files for a look at the timings of a few important points.
in kmsg:
|OPTBOOT: INIT START|
represents (close to) the entry point of init's main

in both:
|OPTBOOT: Starting B2G|
represents the b2g service being started. This is also shared with logcat, since this time is
also used to synchronize with the logcat log which is only reported in terms of absolute time.
This is needed since once one gets high enough in the application layer
it becomes very difficult to message the kernel logs.

in logcat:
|Content JS LOG at app://verticalhome.gaiamobile.org/js/app_manager.js:126 in anonymous: OPTBOOT: Vertical: app_manager.js:126|
A message from javascript-land. In particular near the entry point for the Vertical Homescreen application.
It should be noted that this occurs around a second or so before things are put on the screen.
In the trials for which b2g survives, if one calculates the offset from boot of the Vertical home screen log message, one sees that it is about 24s as opposed to 26s in the trials it crashes.


