MemoryProfiler
This page describes the idea of a profiler that focuses on the memory footprints of execution flows.
Contents
Objectives
Traditional memory analysis tools look at the data. They build the referring-to, namely retaining graphs. This is helpful in exploring the relationships among objects and identifying memory leaks. However, the information exposed in this way is usually a snapshot and the history of how memory is used is missing. Moreover, they usually don't keep tracks of how objects are allocated. Developers have to infer how an object might be allocated and freed by himself/herself.
Another common approach is to plot the allocations or the memory usages along the timeline. This gives some intuition of how and when a bulk of objects are allocated. However, it still relies on developers' wisdom, and sometimes chances, to dig out the problematical code snippet.
This memory profiler is designed to solve the inconveniences and limitations. The goal is to identify the memory eager codes directly. For example, it can show which functions retaining most:
   SelfSize   TotalSize  Name
    4653056     9502720  p/this.start (https://marketplace.cdn.mozilla.net/media/fireplace/js/include.js?b=1412710964149:8)
    1310720     2097152  a (https://marketplace.cdn.mozilla.net/media/fireplace/js/include.js?b=1412710964149:11)
    1245184     1245184  nsJSContext::GarbageCollectNow
    1179648     1179648  PresShell::DoReflow
     983040      983040  nsCycleCollector::collectSlice
     983040      983040  IPDL::PHttpChannel::RecvOnTransportAndData
     851968      851968  t/t.prototype._create (https://marketplace.cdn.mozilla.net/media/fireplace/js/include.js?b=1412710964149:12)
or having highest peaks:
    SelfHWM    TotalHWM  Name
    6225920    17563648  p/this.start (https://marketplace.cdn.mozilla.net/media/fireplace/js/include.js?b=1412710964149:8)
    6029312     6029312  s (https://marketplace.cdn.mozilla.net/media/fireplace/js/include.js?b=1412710964149:11)
    4784128     4849664  nsDisplayBoxShadowOuter::Paint
    1966080     1966080  IPDL::PHttpChannel::RecvOnTransportAndData
    1769472     6684672  a (https://marketplace.cdn.mozilla.net/media/fireplace/js/include.js?b=1412710964149:11)
    1572864    18153472  u (https://marketplace.cdn.mozilla.net/media/fireplace/js/include.js?b=1412710964149:8)
    1572864     1572864  nsJSContext::GarbageCollectNow
    1507328     1507328  PresShell::DoReflow
    1507328    13500416  p/<.run/x/< (https://marketplace.cdn.mozilla.net/media/fireplace/js/include.js?b=1412710964149:8)
Contributing
The memory profiler code has been landed in mozilla-central. The user interface has been developed as an add-on hosted on Github. Your contributions is welcome. Open pull request directly or send questions to dev-platform@lists.mozilla.org.
The Design
The memory profiler samples allocation events. An allocation event includes a type (what and at where is going to be allocated), a size, a timestamp and the corresponding stack trace. Free events are also tracked. For managed languages, namely languages relying on garbage collection, a free event is generated when an object is reclaimed by the garbage collector.
These sampled events can be used to approximate the full history of allocations afterwards. That means we can get various memory profiles of a program in different perspectives by post-processing the history in different ways.
The profiler is designed at the very beginning to support not only JavaScript but also native codes. Naturally, not only JavaScript objects but also native allocations are tracked.
Applications
Besides the two examples showing the functions retaining most and having highest peak, it can be used to find out functions, code snippets or call paths allocating most.
In addition to the ranking list, a call-tree can also be rendered.
With the help of the timestamp, a size-time map can be plotted, too.
Features
The profiler is composed of two parts: the sampling engine and the front-end. Currently most of the efforts are devoted to the back-end and only a few JavaScript examples (quite useful but less convenient than you would expect) is available to give access to the profiler.
The profiler will be able to
- Provide a way to start/stop
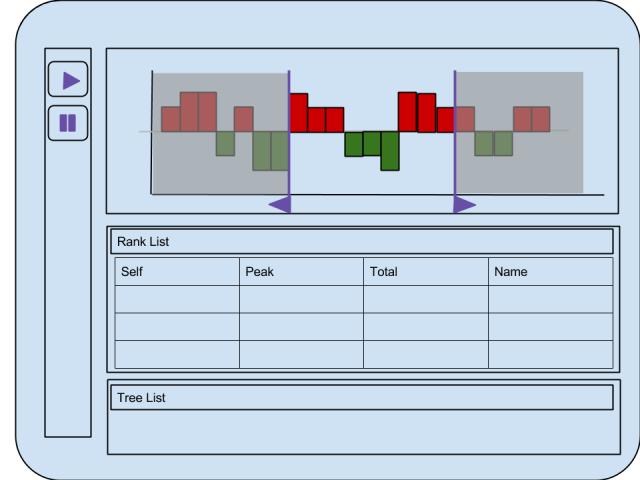
- A timeline that:
- shows the overall memory usage history
- allows zooming into a time interval for the following views
- A rank-list view that shows top functions that are most memory eager
- 6 measurements: {retained, allocated, peak} x {self, inclusive}
- A tree view that shows functions as call trees
- 6 measurements: {retained, allocated, peak} x {self, inclusive}
- A filter to focus on interested functions
- Click item in rank list view or tree view, when item is clicked
- Show traces related to item in rank-list view
- Highlight related path in tree view
- Click item in rank list view or tree view, when item is clicked
Work in Progress
Meta Bug
| ID | Summary | Priority | Status |
|---|---|---|---|
| 1059139 | [Meta] Prototyping a Memory Profiler | -- | RESOLVED |
1 Total; 0 Open (0%); 1 Resolved (100%); 0 Verified (0%);
Dependencies
| ID | Summary | Whiteboard | Keywords | Assigned to | Status |
|---|---|---|---|---|---|
| 1028418 | Minimize stack walking needed in SavedStacks::saveCurrentStack | Nick Fitzgerald [:fitzgen] [⏰PST; UTC-8] | RESOLVED | ||
| 1056373 | [jsdbg2] Debugger.Memory allocation log and related functions should support sampling, not just full logging | Nick Fitzgerald [:fitzgen] [⏰PST; UTC-8] | RESOLVED | ||
| 1056992 | JSClass needs a hook to construct ubi::Nodes specialized for its instances | REOPENED | |||
| 1057057 | JS::ubi::Node should understand DOM structure | NEW | |||
| 1057093 | JS::ubi::Node should expose the buffers held by <img> tags. | NEW | |||
| 1123237 | Implementing a sampling based memory profiler | [MemShrink:P2] | Kan-Ru Chen [:kanru] (UTC+9) | RESOLVED | |
| 1474383 | JSRuntime needs a hook to construct ubi::Nodes specialized for nsINode instances | Kris Wright :KrisWright | RESOLVED |
7 Total; 3 Open (42.86%); 4 Resolved (57.14%); 0 Verified (0%);
Terminology
- trace: denote a complete call tree from root to leave items. A profiling result may end with several traces.
- item: each element in a trace is an item.
