Platform/GFX/Telemetry
Contents
moz-gfx-telemetry
URL: https://firefoxgraphics.github.io/telemetry/
Repo: https://github.com/firefoxgraphics/moz-gfx-telemetry
FailureId Reporting
Starting in Firefox 50 we've landed infrastructure to report WebGL ideas (and could add for other graphics features). This data is reported to telemetry under the following telemetry probes:
- CANVAS_WEBGL_ACCL_FAILURE_ID
- CANVAS_WEBGL_FAILURE_ID
A good way to explore this data is sql.telemetry.com pivot tables. This let's you decide how you want to slice and decide the data to look for low hanging fruits and correlation between possible failures and hardware:
https://sql.telemetry.mozilla.org/queries/492/source#812
Drag and re-order the columns and rows.
Tutorial
As of Firefox 39, telemetry pings include information about the OS and graphics card environment. This includes driver information (date, version), vendor, and device IDs. With this data, we can begin answering questions like, "How many users will be affected if I block GeForce 8800GT cards?" or "How many users run Intel drivers 8.9.2.1923 on Windows 7?"
This document is a short tutorial on how to use our Telemetry tools to answer questions like this.
Getting Started
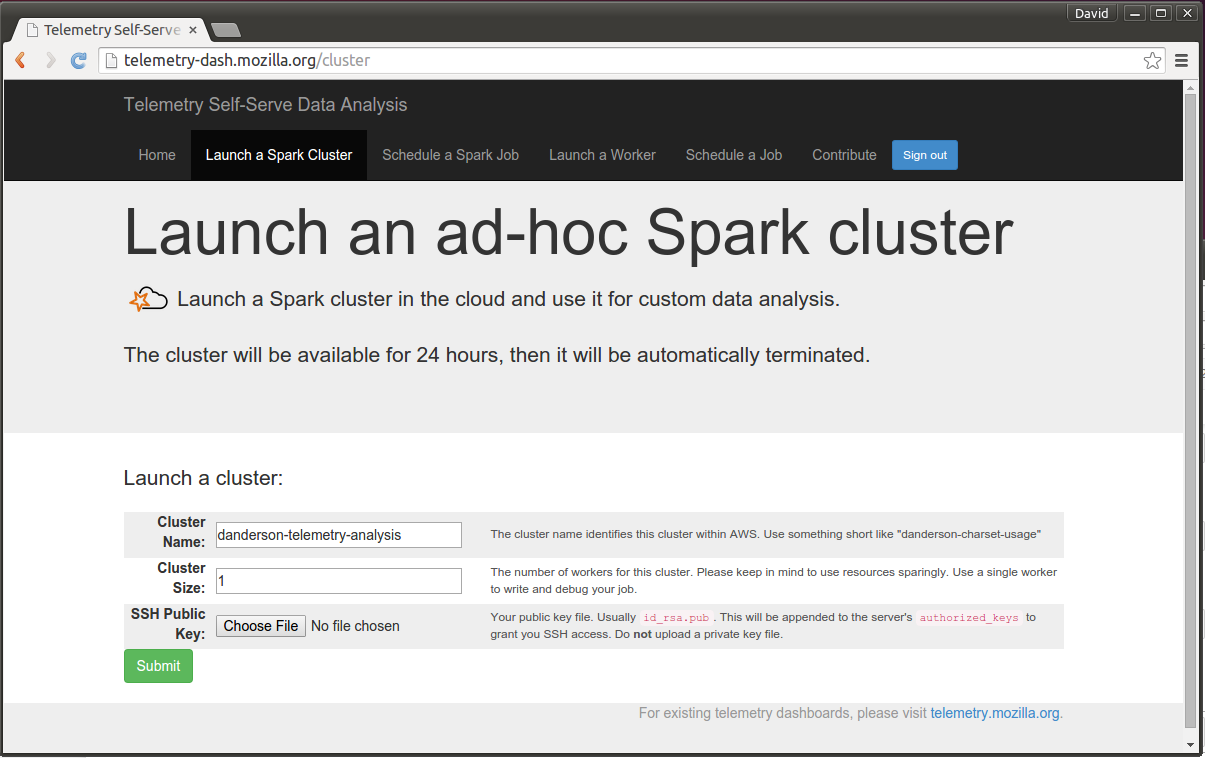
First, visit Telemetry Self-Serve Analysis and log in with your LDAP account. Click "Launch a Spark Cluster", and add your SSH public key:
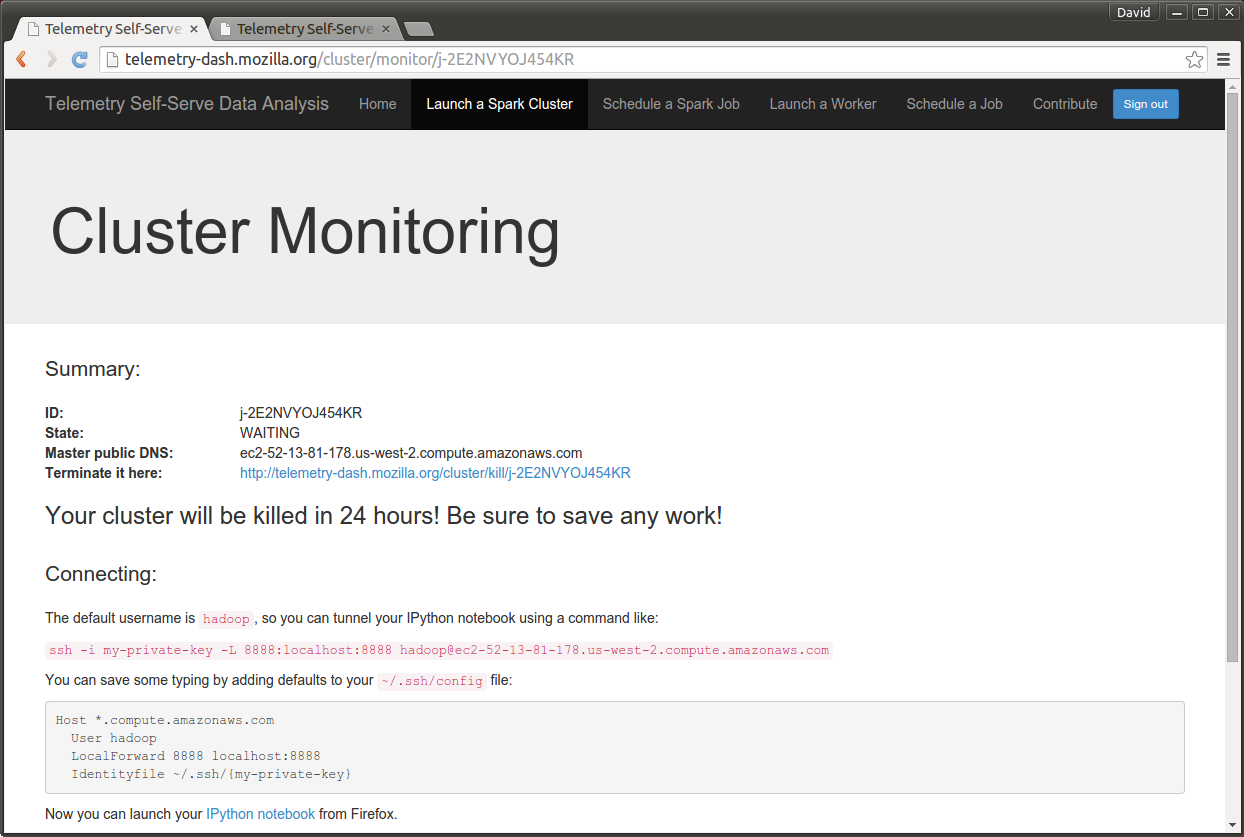
The Spark Cluster is an EC2 instance and will take a few minutes to launch. You may have to manual refresh. When it's ready, you will see a screen like this:
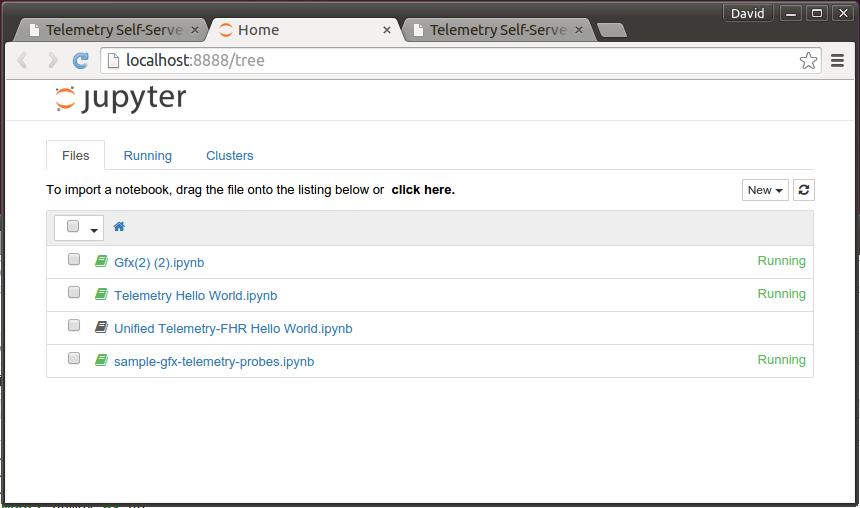
First, run the SSH command provided. This will tunnel into the Spark cluster. Then, visit the "IPython notebook" link. You should see something like this:
Although you can use the sample scripts as a starting point, I've created a sample one for this tutorial. You can view it here or download it:
curl -O https://raw.githubusercontent.com/dvander/moz-gfx-telemetry/master/samples/sample-gfx-telemetry-probes.ipynb
Upload this file into IPython Notebook, then open it.
Running the Analysis
The IPython Notebook editor is a series of code blocks. Each can be run separately and has its own standard out, below the block. Global variables and functions are shared across blocks.
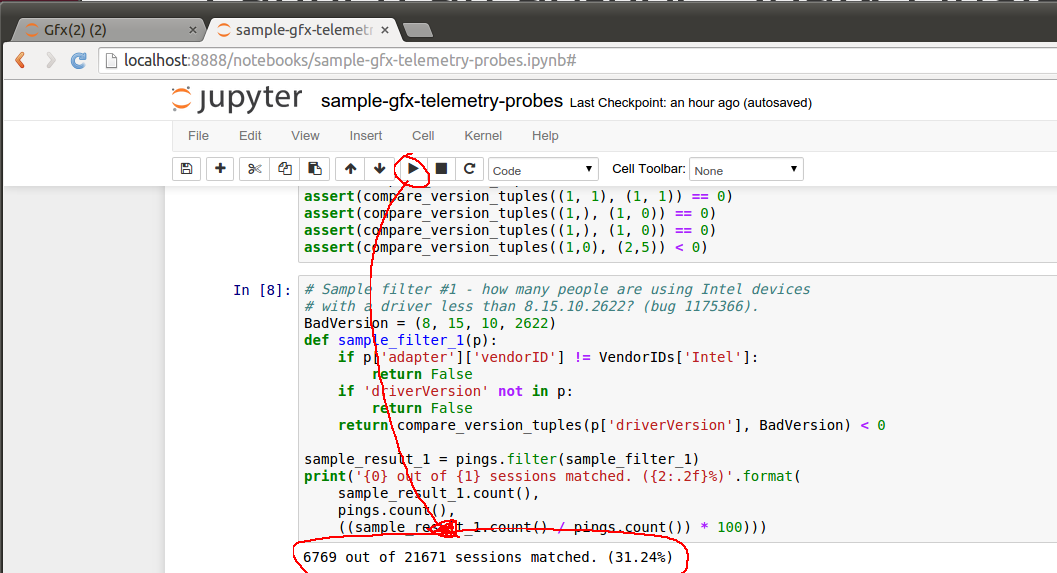
To run the analysis, click the Run button on each code block, and proceed to the next one after the previous completes. (Or just run them all at once). The steps are:
- Import headers.
- Set up the high-level filters, such as how many days of pings to get, what the sample size should look like, and whether to restrict pings to a specific Firefox release.
- Get a sample ping selection based on the filters.
- Massage the sample pings into an easy key/value format.
In addition, there are two analyses at the bottom of the file. The first asks, "How many people are using Intel devices with a driver less than 8.5.10.2622?" This is a question related to bug 1175366. Running this analysis on a 14-day window of 0.1% of users, I get:
BadVersion = (8, 15, 10, 2622)
def sample_filter_1(p):
if p['adapter']['vendorID'] != VendorIDs['Intel']:
return False
if 'driverVersion' not in p:
return False
return compare_version_tuples(p['driverVersion'], BadVersion) < 0
sample_result_1 = pings.filter(sample_filter_1)
print('{0} out of {1} sessions matched. ({2:.2f}%)'.format(
sample_result_1.count(),
pings.count(),
((sample_result_1.count() / pings.count()) * 100)))
6769 out of 21671 sessions matched. (31.24%)
Another sample analysis is how many users have two specific Intel cards that were known to crash in bug 1116812. This is very easy to answer with Telemetry:
# Sample filter #2 - how many users have either devices:
#   0x8086, 0x2e32 - Intel G41 express graphics
#   0x8086, 0x2a02 - Intel GM965, Intel X3100
# See bug 1116812.
#
# Note that vendor and deviceID hex digits are lowercase.
def sample_filter_2(p):
    if p['adapter']['vendorID'] != VendorIDs['Intel']:
        return False
    if p['adapter']['deviceID'] == '0x2e32':
        return True
    if p['adapter']['deviceID'] == '0x2a02':
        return True
    return False

sample_result_2 = pings.filter(sample_filter_2)
print('{0} out of {1} sessions matched. ({2:.2f}%)'.format(
    sample_result_2.count(),
    pings.count(),
    ((sample_result_2.count() / pings.count()) * 100)))

1418 out of 21671 sessions matched. (6.54%)
Tips and Tricks
- Remember that your spark cluster will terminate after 24 hours. Save your .ipynb file, it will not persist to another session.
- When debugging, use a very small sample set. Large samples can be very slow to analyze.
- Analysis objects are pipelined. You can observe a random object in the pipeline with the ".take()" function. For example, to observe a random ping, "pings.take(1)".
- To execute an entire pipeline and observe the full results as a Python object, use ".collect()".
- You can write files as part of the analysis. They will appear in the "analyses" folder on your spark instance.
- Because analysis steps are pipelined until results are observed, it is dangerous to re-use variable names across blocks. You may have to restart the kernel or re-run previous steps to make sure pipelines are constructed correctly.
- You can automate spark jobs via telemetry-dash; output files will appear in S3 and can be used from people.mozilla.org to build dashboards.


